Progress Charts

Progress Charts
See the story behind the scores
Progress isn’t about one result—it’s about the journey.
Test scores are snapshots.
But what really matters is the trajectory: how a student is evolving across time, assessments, and subjects. Are they improving? Plateauing? Struggling more than expected?
Progress Charts let you track academic development visually and intelligently, so you can identify patterns, support early, and celebrate real improvement—not just high marks.
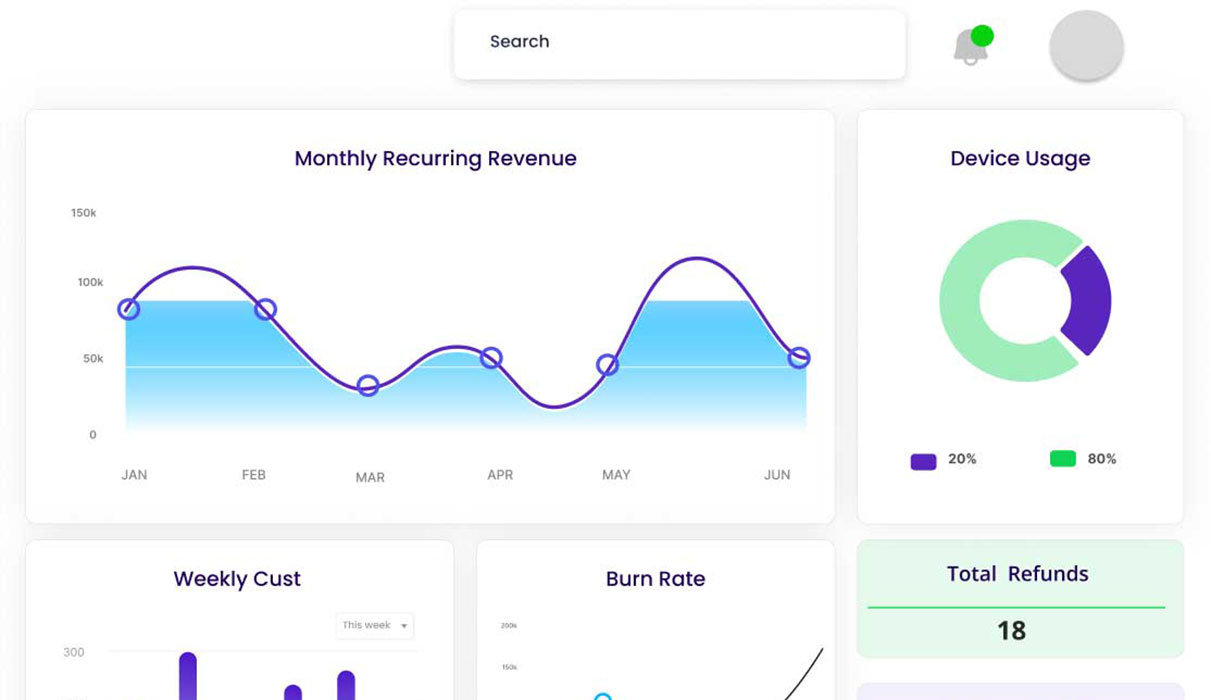
Better decisions with visual trends
Visual Growth Over Time
Understand trends, not just grades. Charts display student performance across terms or years, allowing teachers and coordinators to interpret progress at a glance.
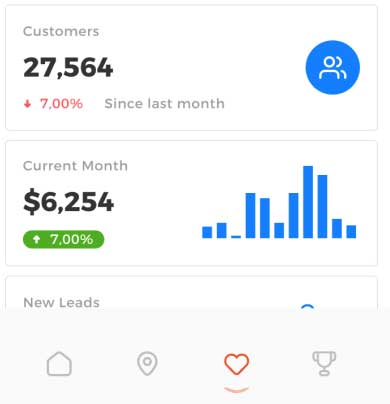
Individual and Group Views
From single students to entire classes. Switch seamlessly between student-specific progress or whole-group dynamics to adapt your teaching strategy.
Subject and Skill-Based Analysis
Dig deeper into what’s improving. Track performance by topic, skill area, or question category to uncover which parts of the curriculum are working—and which need reinforcement.
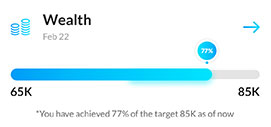
Early Warning Insights
Spot stagnation or regression early. Compare expected vs. actual progress to detect when a student—or a class—isn’t growing as it should.
Comparative Tracking
See growth in context. Compare a student’s progress to the class, year group, or historical data. Measure relative improvement, not just raw scores.
Export and Share Easily
Use charts in reports and meetings. Generate ready-to-share visuals for term reports, internal reviews, or academic boards—clear, polished, and impactful.